Characterizing Microservice Dependency and Performance: Alibaba Trace Analysis

This paper got the best paper award at SOCC 2021. The paper conducts a comprehensive study of large scale microservices deployed in Alibaba clusters.  They analyze the behavior of more than 20,000 microservices in a 7-day period and profile their characteristics based on the 10 billion call traces collected. They find that:

  • microservice graphs are dynamic in runtime
  • most graphs are scattered to grow like a tree
  • size of call graphs follows a heavy-tail distribution

Based on their findings, they offer some practical tips about improving microservice runtime performance. They also develop a stochastic model to simulate microservice call graph dependencies and show that it approximates the dataset they collected (which is available at https://github.com/alibaba/clusterdata).

What are microservices?

Microservices is a software development approach that divides an application into independently deployable services, owned by small teams organized around business capabilities. Each service communicates through well-defined APIs, making the application easier to scale and faster to develop. In contrast, monolithic architectures tightly couple all processes as a single service, and may make it difficult to add or improve features and experiment. Thanks to their decoupled architecture, microservices allow for rapid and frequent deployment of services, enable innovation and accelerate time-to-market for new features, while reducing unavailability.

This is when things work well. Often things are not that clean. Galactus, the all knowing user-service-provider-aggregator, expects a time range from EKS, which is being deprecated to OmegaStar, which still doesn't support ISO timestamps. And unless OmegaStar gets its fucking shit together, everything is blocked. You think you know what it takes to tell the user it's their birthday? You know nothing!

Alibaba trace overview

A microservice runs over multiple containers. A call to a frontend microservice triggers calls to other microservices, and so on. In the resulting call graph, each edge connects an upstream microservice (UM) to a downstream microservice (DM) it calls. The response time (RT) of a call is the time between the UM calling its DM to it receiving the response.

Alibaba clusters use Kubernetes to manage the bare-metal machines. Online services (e.g., microservices) and offline batch jobs coexist in the same bare-metal node to increase resource utilization. Stateful services (i.e., database and Memcached) are deployed in a dedicated cluster.

Microservice call graph properties

The size of microservice call graphs follows a heavy-tail distribution. Around 10% of call graphs consist of more than 40 microservice stages. The largest call graph can consist of even hundreds to thousands of microservices. For call graphs containing more than 40 microservices, about 50% of their microservices are Memcacheds (MCs).


How about the depth of the call graphs? Figure 3(b)  shows that the depth peaks quickly at height=3 as microservices query hot data cached in MCs directly. That said, more than 4% of call graphs present a call depth of more than 10.


A microservice call graph is topologically similar to a tree. In Alibaba's microservice traces, a majority of nodes have in-degrees of one. More than 10% of stateless microservices have an out-degree of greater than 4. A non-negligible fraction of microservices are hot-spots. As shown in Figure 4, more than 5% of microservices have in-degrees of 16 in aggregate calls. These super microservices appear in nearly 90% of call graphs and handle 95% of total invocations.

Microservices can form highly dynamic call dependencies in runtime. In an extreme case, the same online service can have more than nine classes of topologically different graphs as shown in Figure 6. (These different classes of graph topologies was identified by a K-means clustering algorithm.)

The call patterns of stateless microservices vary a lot over tiers. A noticeable fraction of stateless microservices are blackholes since they have no DM. The rest of microservices (or normals) shall call their DMs with a certain probability. As shown in Fig. 8(a), the percentage of black holes (respectively, relays) increases (respectively, decreases) with the call depth growing. It is quite challenging to simulate production call graphs using simple mathematical models. The authors build a stochastic model to simulate the dynamic dependencies between microservices, and show that this closely approximates the dataset they collected. In contrast, they say the previous open-sourced microservice benchmarks fail to preserve microservice call graph properties since their call graph sizes are quite small and the produced graph topologies do not change much.

Figure 8(b) shows that the percentage of communications between stateless microservices and Memcacheds (i.e., S2M) reduces linearly in call depth when the depth is above three. This indicates the cache miss rate of queries increases quickly as call graphs get deeper. When the data misses a hit in caches, the query is sent to the database service.


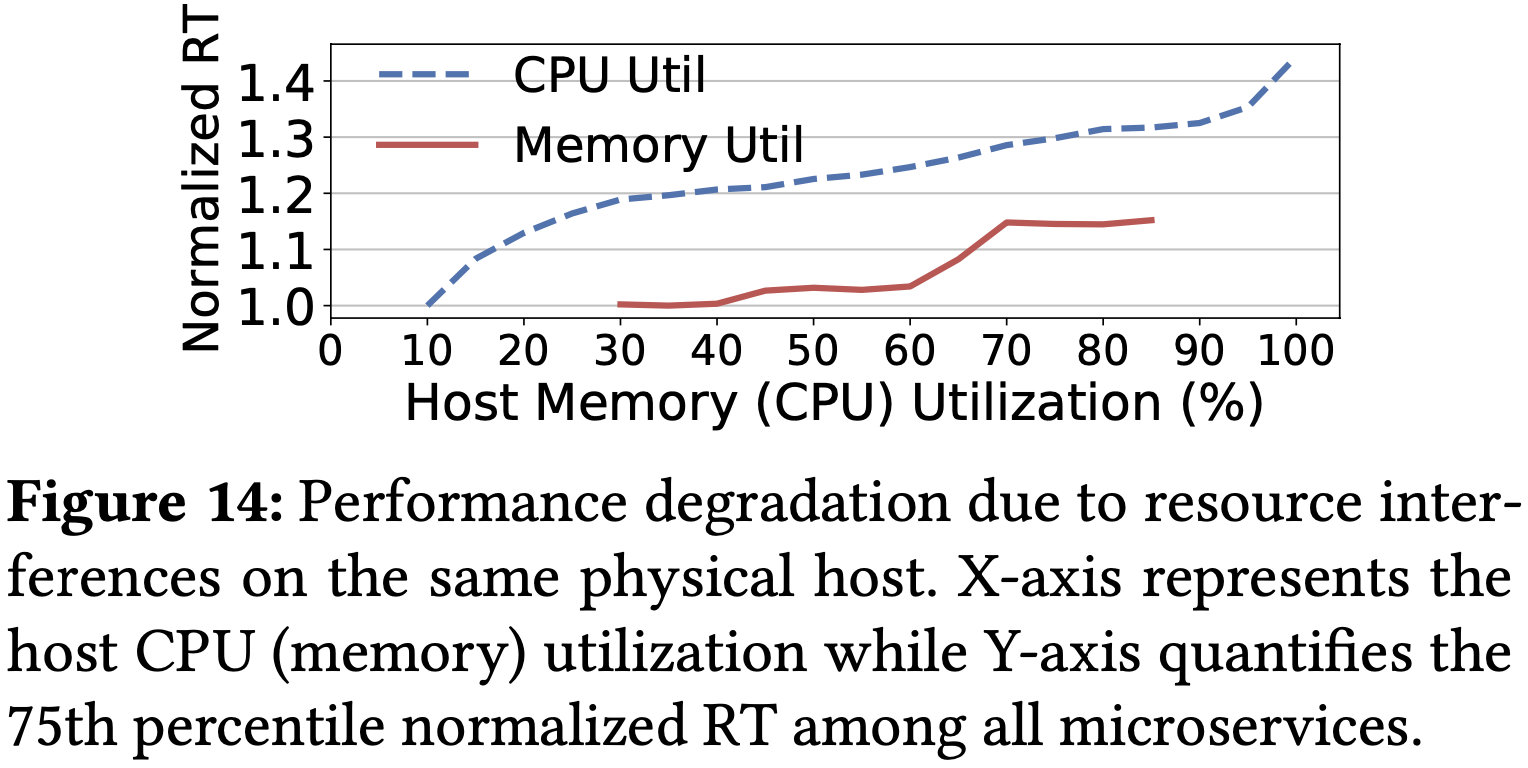
Microservice run time performance

A noticeable fraction of pairs have strong coupled dependency and their interfaces can be coupled together for performance optimization. Fig 10 shows the distribution of the product of Call Time and Call Probability.
More than 10% of the pairs of microservices have a product >=5, implying that a lot of microservice pairs in Alibaba clusters have a strong coupled dependency. 17% of these pairs with strong coupled dependency do not share DM with any other microservice. For these pairs, coupling the called interface of DM with the corresponding interface of UM together can substantially reduce the communication overhead since coupling can replace a remote call with a local self-call and reduce network traffic.

Figure 12 shows that microservice call rates highly correlate with CPU utilization and Java young generation garbage collection (Young GC) but not with memory utilization. This implies that CPU utilization and Young GCs are much better indicators of resource pressures of microservice containers compared to memory utilization. Memory utilization is almost stable at runtime in most containers in Alibaba microservice traces (with a variance of less than 10%).

Response time (RT) can be greatly degraded due to high host CPU utilization. When the host CPU utilization exceeds 40% (or respectively 80%), the RT of a microservice can be degraded by more than 20% (respectively 30%) in average. The host memory utilization has a much lighter impact on the RT. When the host memory utilization is below 60%, the interference can be ignored. These results indicate most online microservices are sensitive to CPU interference and there is a strong demand for a more efficient resource scheduler that can well balance the CPU utilization across different hosts. Traces show that the variance of CPU utilization across hosts in each minute can be as high as 20%, implying there is an opportunity to balance the batch workload across hosts better.

Comments

Popular posts from this blog

The end of a myth: Distributed transactions can scale

Hints for Distributed Systems Design

Foundational distributed systems papers

Learning about distributed systems: where to start?

Metastable failures in the wild

Scalable OLTP in the Cloud: What’s the BIG DEAL?

The demise of coding is greatly exaggerated

SIGMOD panel: Future of Database System Architectures

Dude, where's my Emacs?

There is plenty of room at the bottom